Key Takeaways
- Google impressions show that your social content appeared; they do not prove that the visibility was valuable.
- Examine the queries behind the impressions to determine whether the visibility is branded, commercially relevant, informational or irrelevant.
- Evaluate Search Console data alongside social, website and lead signals, but do not confuse correlation with attribution.
- Look for patterns across multiple posts and queries before changing your content strategy.
- Turn useful findings into a clear action: monitor, repeat, expand, repurpose or deprioritise.
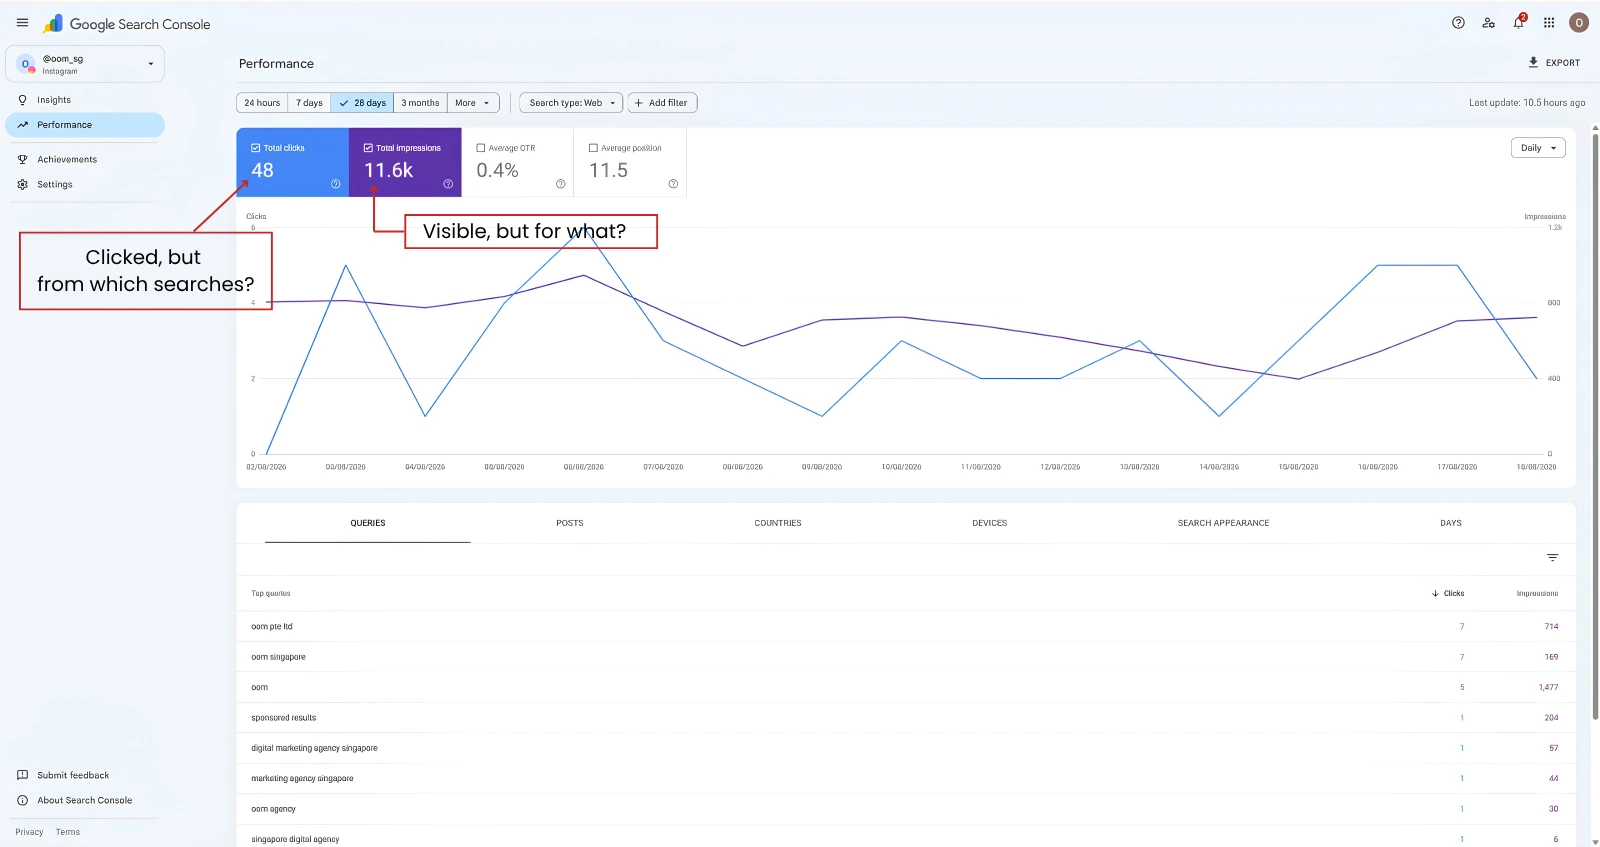
You open Google Search Console and see this for your Instagram account:
11,600 impressions.
48 clicks.
0.4% CTR.
Average position: 11.5.
Is that good?
Does 48 clicks from 11,600 impressions mean the content underperformed? Should you create more of whatever generated those impressions?
The answer is: you cannot tell from those four numbers alone.
And that may be the most important thing marketers need to understand about Google Search Console’s Platform Properties.
Google now allows verified owners of Instagram, TikTok, YouTube and X accounts to see how their content performs across Google Search, Discover and Google News. The reports can show which posts receive visibility and clicks, and what queries people use to discover them.
But more data does not automatically mean more insight.
The opportunity is learning how to connect this new search data with the social and business metrics marketers already have.
Because 11,600 impressions tell you that your content appeared. They do not tell you whether those were the right 11,600 impressions.
That requires interpretation.
Do Not Treat Search Console Like Another Social Dashboard
Social teams already have plenty of metrics.
Reach. Views. Likes. Comments. Shares. Saves. Watch time. Followers.
Google Search Console should not simply become another column in that report.
It answers a different question.
Native social analytics tell you what happened to content within the social platform.
Platform Properties show how that content is being discovered through Google.
Search Engine Land’s Barry Schwartz highlighted one of the practical changes when Platform Properties became globally available: marketers can now access Google performance data for content hosted on third-party platforms they do not own.
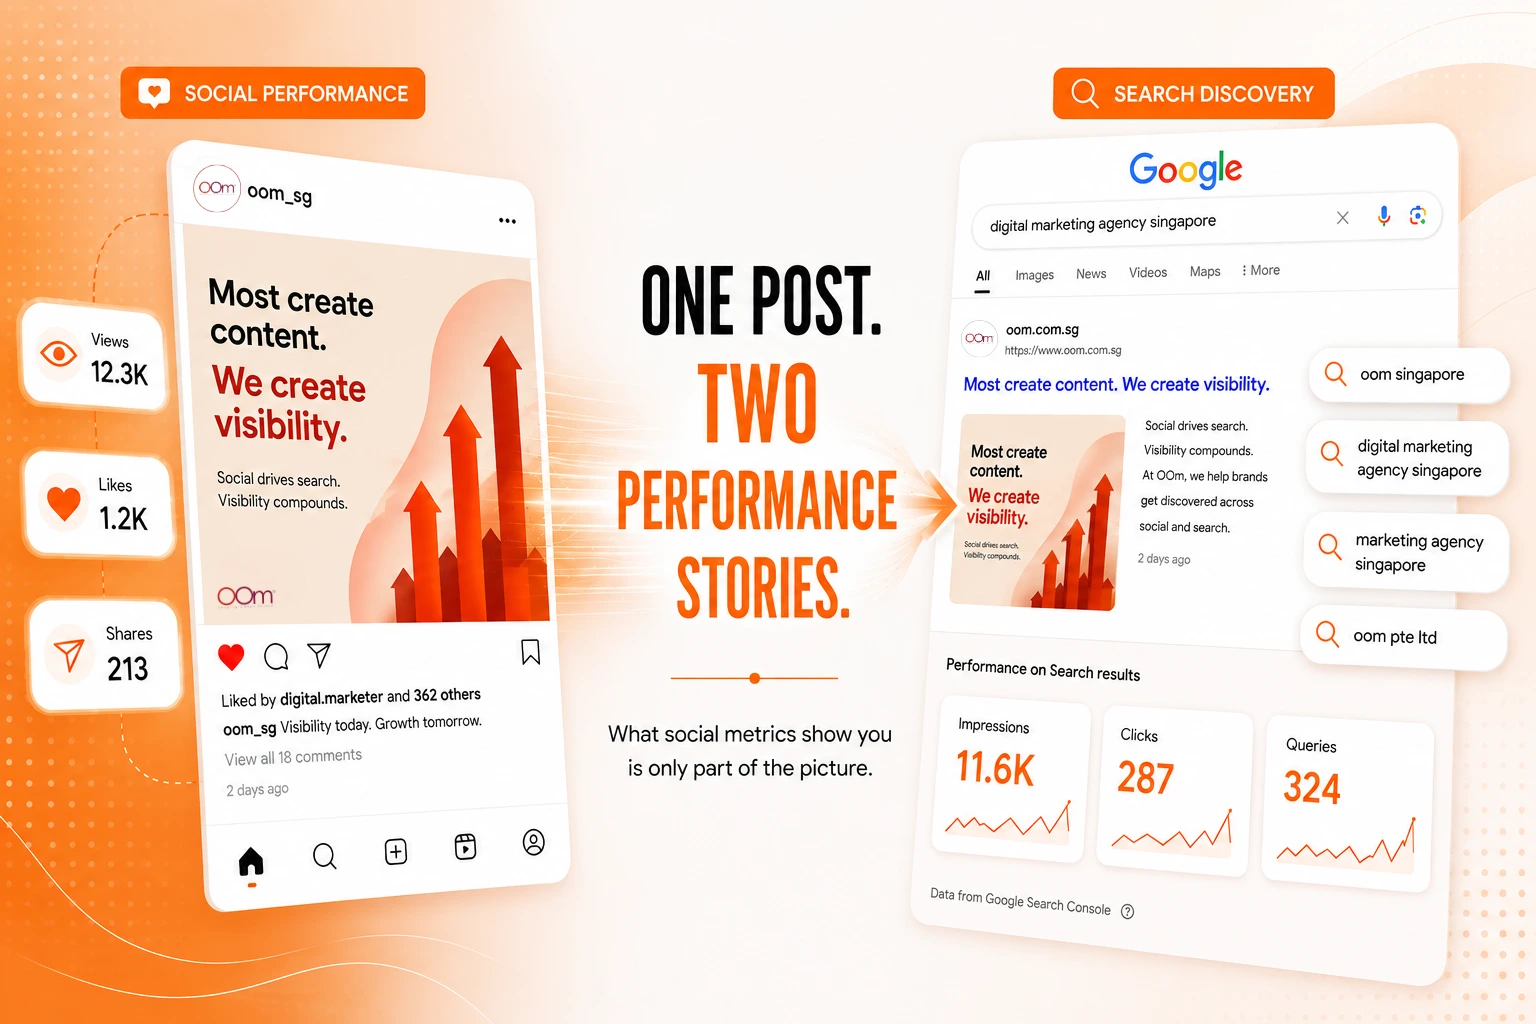
That means a social post now has at least two measurable environments:
Feed Performance: How did the content perform when the social platform distributed it?
Search Performance: How did the content perform when Google surfaced it?
Those results may look very different.
A Post Can Look Average on Social and Still Earn Search Visibility
Consider two hypothetical Instagram posts.
Post A
50,000 Instagram views
2,000 likes
Very little visibility from Google
Post B
8,000 Instagram views
300 likes
2,500 Google Search impressions for relevant queries
Which performed better?
We cannot say from those numbers alone.
Post A appears stronger at generating reach and engagement within Instagram.
Post B has greater visibility through Google Search.
Neither dataset tells us which contributed more to the business.
So instead of forcing every post into a single definition of “good”, evaluate it according to the job it is doing and the environment in which it is performing.
That is where Search Console becomes useful.
Start With the Query, Not the Click
Go back to our example:
11,600 impressions.
48 clicks.
0.4% CTR.
Average position: 11.5.
It is tempting to focus immediately on the 48 clicks or 0.4% CTR.
We would start somewhere else.
Queries.
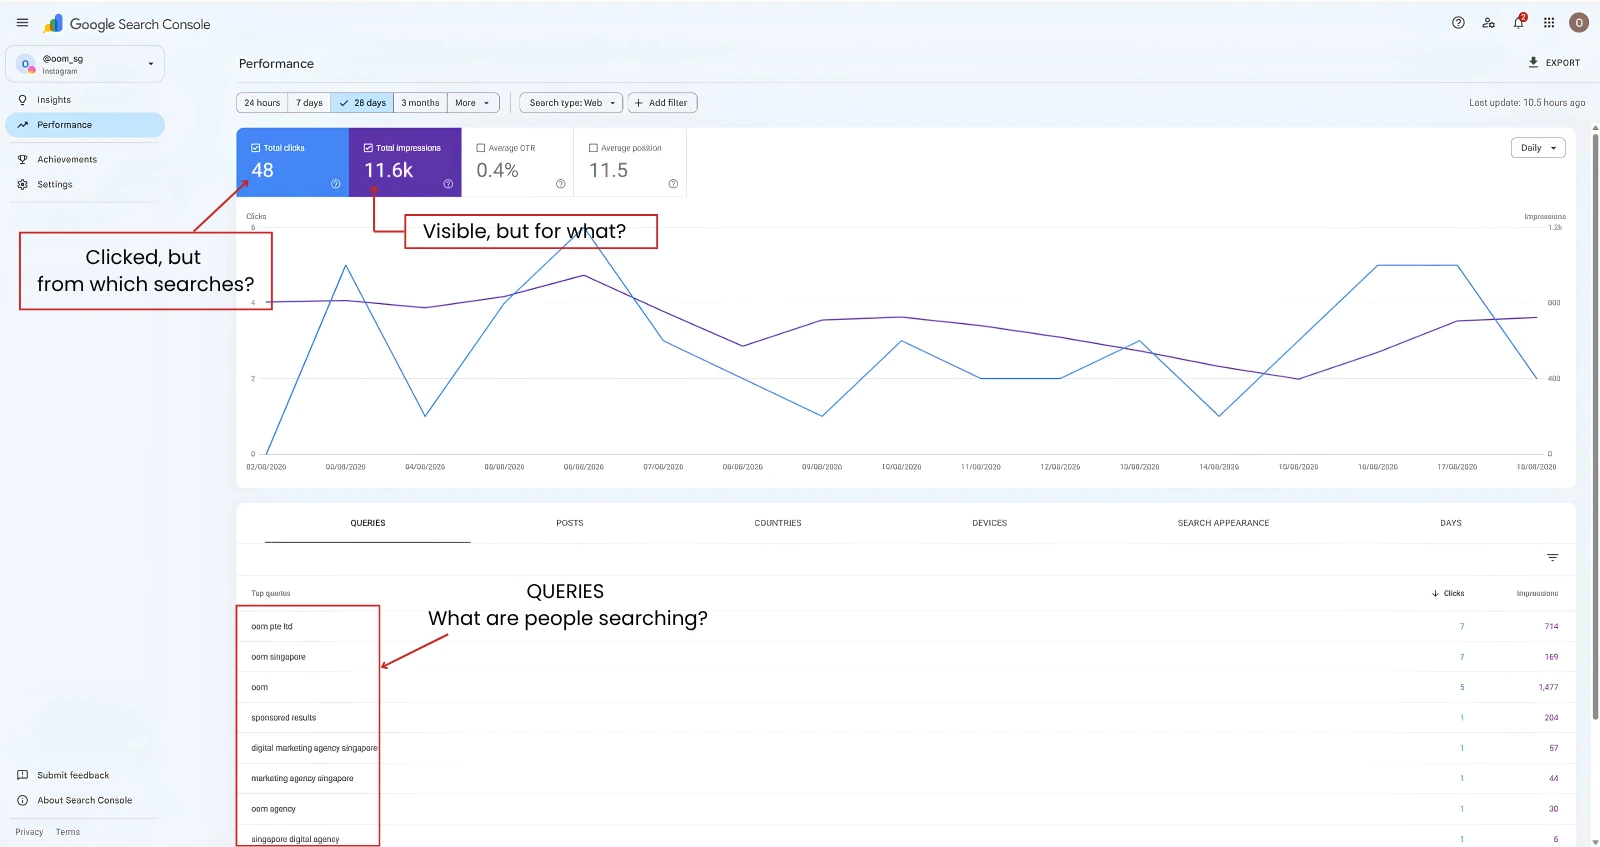
Suppose the Queries report shows searches such as:
“oom pte ltd”
“oom singapore”
“digital marketing agency singapore”
“marketing agency singapore”
The headline number now tells a more useful story. In this example, the impressions come from a mixture of branded searches and broader searches related to the services OOm provides.
Google confirms that Platform Properties can show the search queries people use to discover a social profile and its content. Google also recommends analysing these queries to understand audience interests and inform future content decisions.
So do not just ask:
How many impressions did we get?
Ask:
What did we earn those impressions for?
That is where the analysis starts.
Not All Search Impressions Mean the Same Thing
A useful first step is to separate the queries according to what they reveal.
Branded Discovery
Imagine your Instagram profile appears for:
“oom singapore”
You know your social presence appeared when somebody searched for your brand.
You do not know what originally created that demand.
The person could have encountered the brand through an advertisement, recommendation, event, website or another source.
So the defensible conclusion is:
Our Instagram presence is visible for searches relating to our brand.
Useful information, but not attribution.
Non-Branded Discovery
Now consider:
“digital marketing agency singapore”
The search does not depend on somebody already knowing OOm.
If your social content appears for it, you have evidence that the content is receiving Google visibility for a commercially relevant topic.
That does not mean the impression generated a customer.
But it tells you that your social content is being surfaced within a category people are searching for.
Informational Discovery
Then there are searches such as:
“why did my website traffic drop”
or
“how to improve google rankings”
These queries reveal something beyond performance.
They reveal questions.
And questions can become content opportunities.
Google recommends using the search terms that lead people to social content to inform future videos, captions and content.
This means the Queries report can become more than a performance report.
It can become an input into your content strategy.
So, Are 11,600 Impressions Good?
We still do not know.
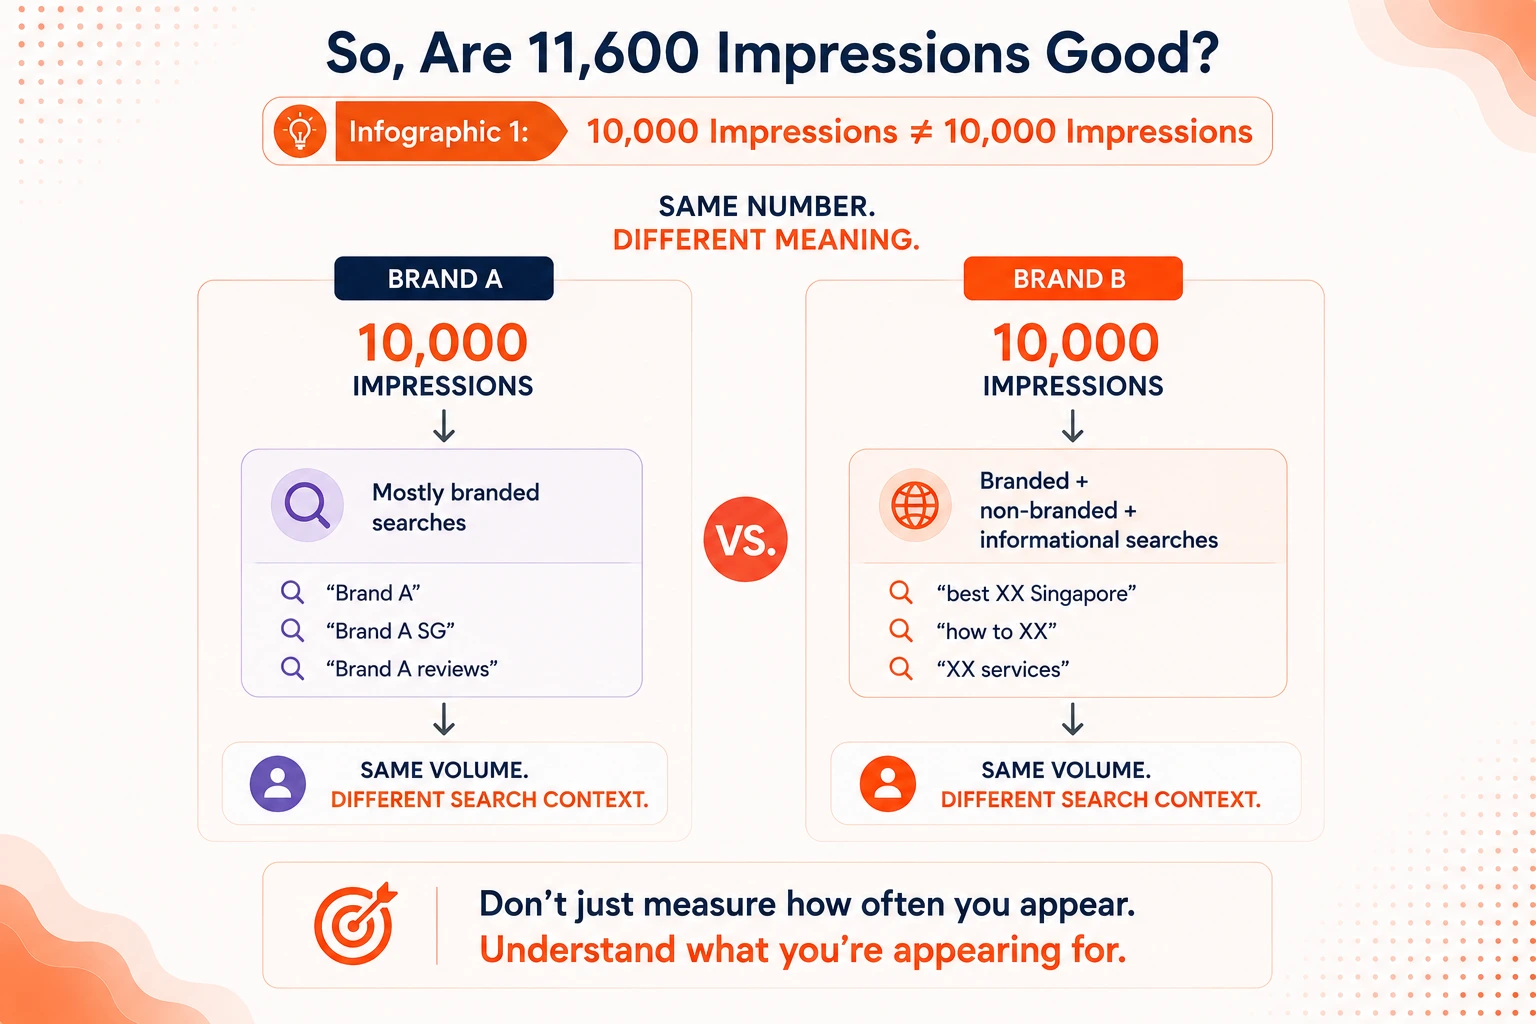
Imagine two brands.
Both receive 10,000 Google impressions for their Instagram content.
For Brand A, 9,000 come from variations of its company name.
For Brand B, the impressions are spread across relevant non-branded and informational searches relating to its products and services.
The headline metric is identical.
What the metric represents is not.
That is why we would not evaluate Platform Properties based on impression growth alone.
Instead, OOm recommends looking at what we call:
Relevant Search Visibility
Relevant Search Visibility is not a Google metric or a validated scoring model. It is a practical method OOm can refine as more Platform Properties data becomes available. To apply it, classify each query as branded, commercial non-branded, informational or irrelevant. Then assess whether the query matches the post, relates to a customer problem and connects to something the business offers. Finally, assign the post an action: monitor, repeat, expand, repurpose or deprioritise.
Instead of asking:
“Are our Google impressions increasing?”
Ask:
“Is our social content appearing for searches that matter to our audience and business?”
An impression tells you that you appeared.
The query tells you what you appeared for.
Together, they are more useful.
How Do You Know Whether an Individual Post Is Working?
Move next to the Posts report.
But do not simply sort by clicks and declare the first result your “best post”.
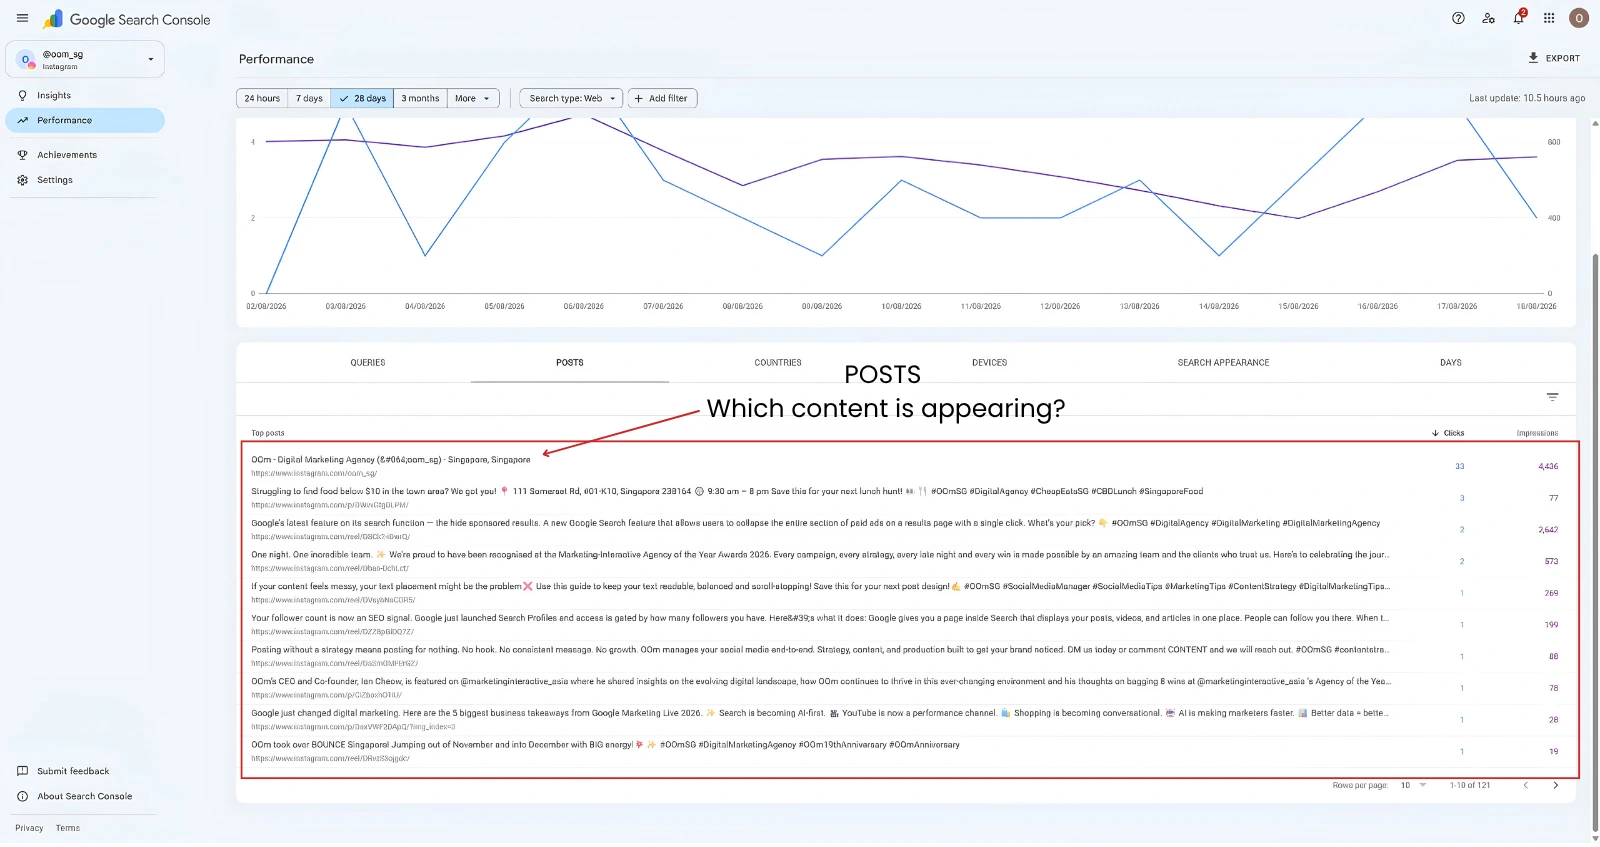
Use four questions.
1. Is Google Showing It?
Does the post receive Google impressions?
Is visibility increasing, declining or remaining relatively stable?
Has an older post started receiving impressions again?
At this stage, the conclusion is simple:
Google is surfacing this content.
Nothing more needs to be claimed.
2. What Is Google Showing It For?
Filter by the post and examine its queries.
Suppose:
Post A: 5,000 impressions across loosely related queries.
Post B: 500 impressions concentrated around searches directly related to a service you provide.
Post B may warrant closer attention despite having fewer impressions.
Ask:
Does the query match the content?
Does it relate to a customer problem?
Is it relevant to something we offer?
Is it branded, commercial non-branded, informational or irrelevant?
Now you are analysing the relevance of the visibility, not simply its volume.
3. Are People Clicking?
Now consider clicks and CTR alongside average position and query intent.
High impressions with low clicks could have several explanations. The result may be appearing lower on the page, the query may not align closely enough with the content, or competing results may better satisfy the searcher.
Search Console cannot tell you exactly why someone did not click.
So low CTR should not automatically become:
“This post failed.”
Instead ask:
What does the relationship between query, position, impressions and clicks tell us?
4. What Happens Beyond Search Console?
Suppose a post receives Google visibility for a commercially relevant topic.
During the same period, you also see stronger traffic to a related service page, more branded searches or enquiries relating to that service.
Do not immediately conclude:
“The social post drove those enquiries.”
A more defensible interpretation is:
We are seeing multiple signals of interest around the same topic across social, search and our website.
That is worth investigating.
But correlation is not attribution.
Measurement Is Not Attribution
This is one of the most important distinctions when using Platform Properties.
Imagine:
Instagram Post
↓
Google Search
↓
Website Article
↓
Branded Search
↓
Direct Visit
↓
Enquiry
Which channel deserves the conversion?
Platform Properties cannot answer that.
What they add is visibility into another measurable interaction:
Google → Social Content
So rather than asking one platform to explain the entire customer journey, use each dataset for what it can actually tell you.
| Measurement Layer | What You Can Learn |
|---|---|
| Social platform analytics | Did people see and interact with the content on the platform? |
| GSC Platform Property | Did the social content appear through Google, and for which searches? |
| Website Search Console | How is your owned website performing in Google Search? |
| Website analytics | What happened when people visited your website? |
| CRM and lead data | Which interactions resulted in enquiries or sales? |
The principle is simple:
Measurement is not attribution.
Search Console gives marketers another measurable part of the journey. It should not be stretched beyond what it can prove.
The OOm Social Search Measurement Framework
So how should marketers put the different signals together?
OOm recommends using the following four-layer framework as a practical starting point. These are measurement layers, not sequential stages: one does not prove or necessarily lead to the next.
1. DISTRIBUTION
Did people see it on the social platform?
Reach
Views
Social impressions
↓
2. ENGAGEMENT
Did people respond to it?
Shares
Saves
Comments
Watch time
Engagement
↓
3. DISCOVERY
Is the content being surfaced through Google?
Google impressions
Search queries
Clicks
CTR
Average position
↓
4. BUSINESS IMPACT
What happened further along the customer journey?
Website visits
Engaged sessions
Key events
Enquiries
Qualified leads
Revenue
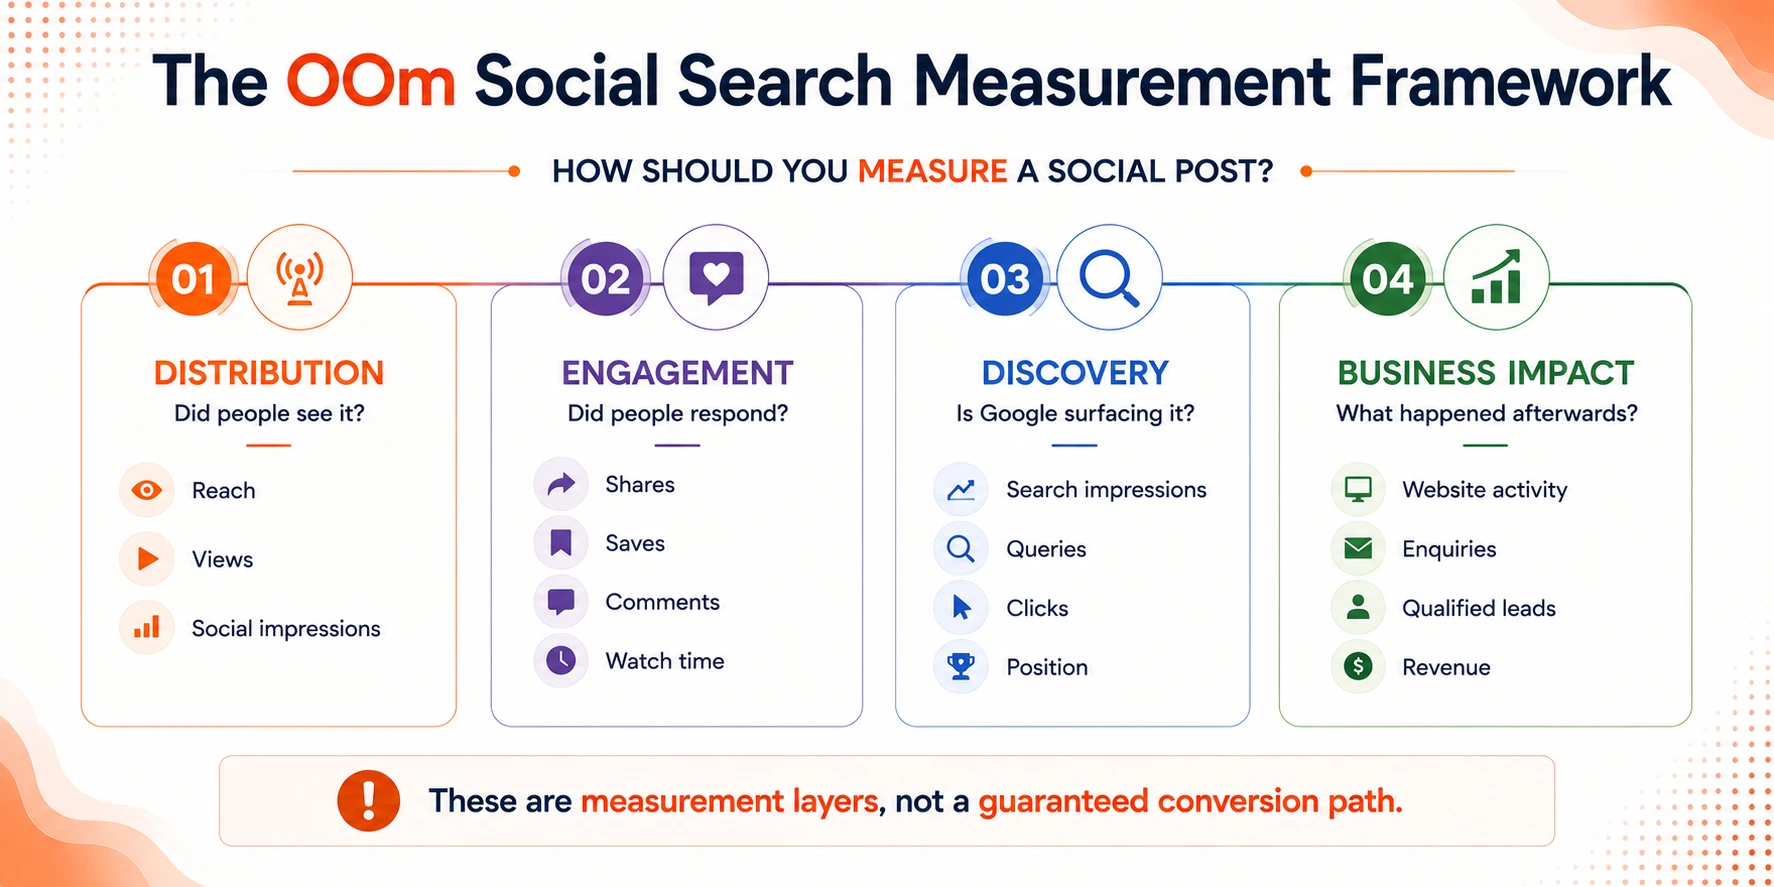
The framework does not imply that Distribution caused Engagement, Engagement caused Discovery or Discovery caused a conversion.
It puts different datasets into context.
That distinction prevents marketers from collapsing everything into one misleading performance number. For a repeatable review, record six fields for each useful query: the query itself, its intent, its business relevance, the post Google surfaced, any related signals elsewhere and the recommended action. The aim is not to calculate a universal score. It is to make the reasoning visible, consistent and reviewable.
Your “Best” Social Post Depends on What You Mean by Best
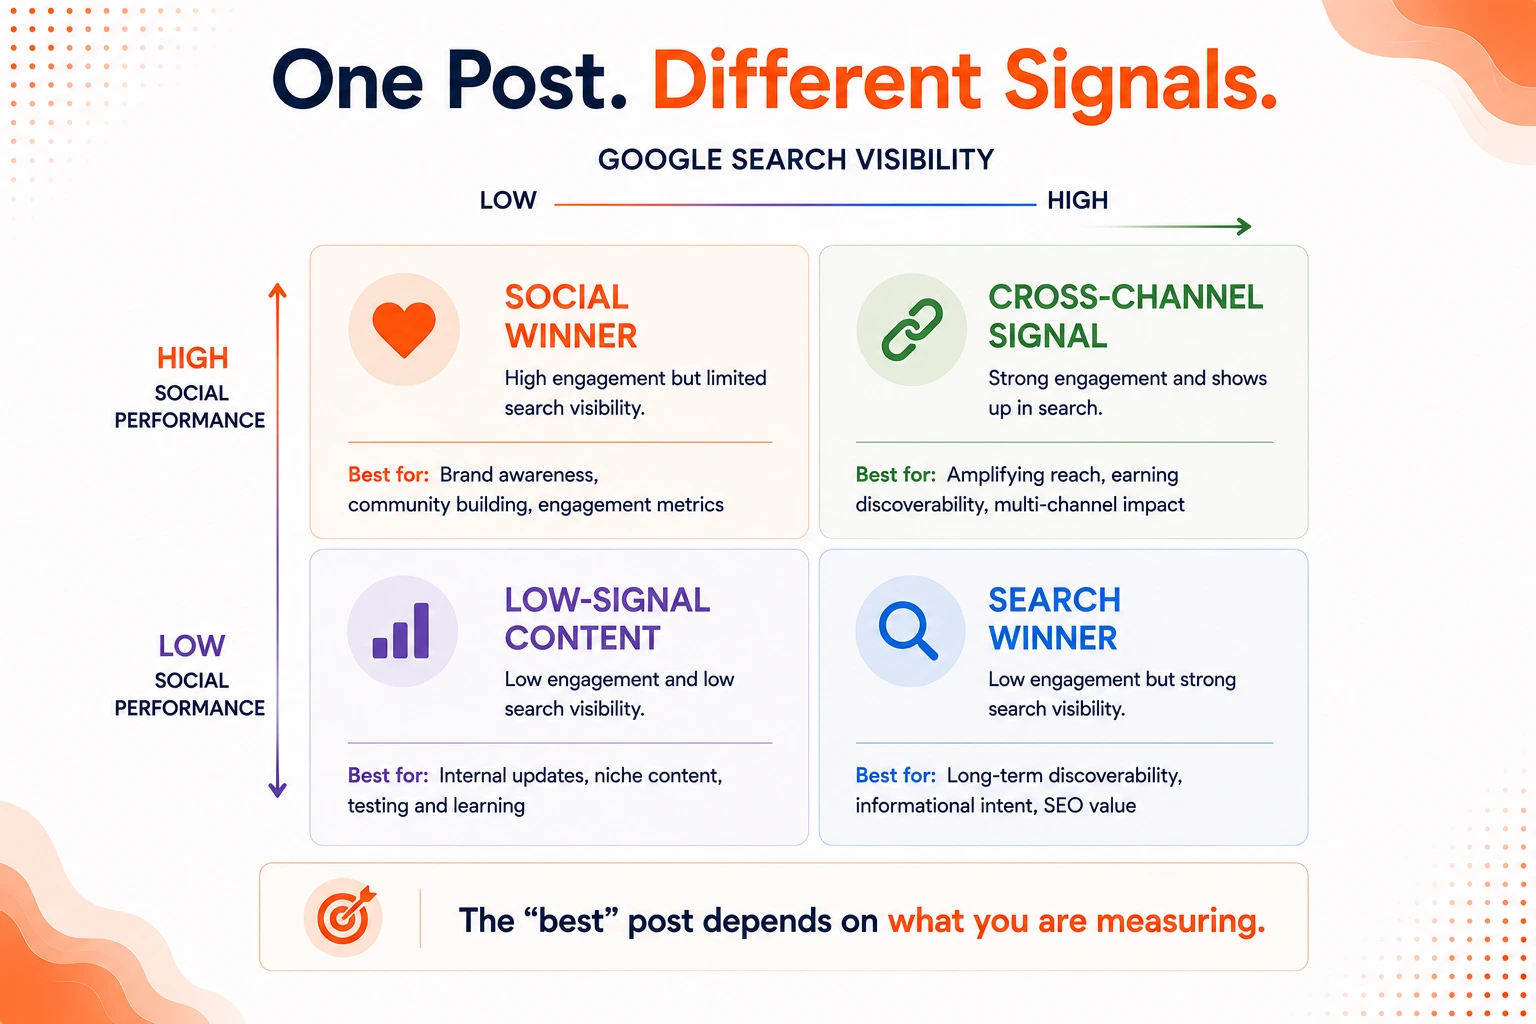
Once content is evaluated across these layers, different types of winners can emerge.
The Social Winner
Strong social reach and engagement, limited Google visibility
The content performed strongly within the social platform.
What next? Study the topic, hook, creative execution and format. Identify what is worth testing again.
The Search Winner
Moderate social performance, strong relevant Google visibility
The content is being surfaced through Google for relevant searches.
What next? Examine the queries. They may justify expanding the subject into another post, longer video, FAQ, article or website content.
The Cross-Channel Signal
Strong social performance, relevant Google visibility and related website activity
Do not automatically call this a “conversion-driving post”.
What you have is multiple positive signals around the same topic.
What next? Investigate further and consider whether the subject warrants greater investment across channels.
The Low-Signal Post
Limited engagement, little relevant Google visibility and no notable downstream activity
One post is rarely enough to make a definitive judgement.
But repeated low signals across multiple pieces of content may justify reconsidering the topic, format, execution or audience fit.
This is more useful than:
Likes = good.
No likes = bad.
The Most Valuable Insight May Be What You Create Next
Suppose an accounting firm’s Instagram Reel appears for:
“how much does company incorporation cost singapore”
Do not just put the query into a monthly report.
Ask what it tells you.
The query suggests interest in incorporation costs, and your content is being surfaced for that topic.
That could inform:
Instagram Reel
How Much Does It Cost to Incorporate a Company in Singapore?
↓
Website Article
A detailed breakdown of incorporation costs.
↓
Longer Video
What businesses should budget for when incorporating.
↓
FAQ
What fees should I expect when registering a company?
↓
Service Page
Clearer information addressing costs and common customer concerns.
One search query should not automatically become one new piece of content.
If the same post begins appearing for several related queries, look at what those queries have in common. They may point to a broader customer question that deserves deeper coverage across social, your website or other content formats.
Google explicitly recommends using Platform Properties to identify the queries bringing people to social content, compare content and formats, and use those findings to inform future content decisions.
The opportunity is therefore not simply to report the query.
It is to decide what to do because you found it.
Look for What Is Missing Too
Do not only look at the queries that appear.
Look for the ones you expected to see but do not.
Google itself recommends asking whether there are search terms you would expect to receive traffic from but are not.
Suppose your business offers five major services.
Your social content consistently appears for searches relating to four of them. The fifth barely appears.
That does not automatically mean there is a problem.
But it gives you something to investigate:
Have we created enough useful content around that service?
Are we addressing the questions people actually ask?
Does the same visibility gap exist on our website?
An absence in Search Console becomes a research question.
Not a conclusion.
Compare Formats, Not Just Individual Posts
There is another useful level of analysis.
Instead of only asking:
“Which Reel performed best?”
Ask:
“Are Reels or static posts earning more relevant Google visibility for us?”
Google specifically recommends comparing formats such as Instagram Reels with static posts and YouTube Shorts with longer videos.
Look for patterns across enough content and a meaningful period.
Do not redesign your content strategy because one Reel generated more impressions than one static post.
The value is in identifying repeatable patterns, not isolated winners.
From Channel Reporting to Journey Reporting
This is ultimately where Platform Properties become useful.
A piece of content does not necessarily stay within the channel where it was published.
Someone searching Google can discover an Instagram post.
Someone who encounters a brand on social can later search for it.
Someone reading social content can eventually visit the website.
If every channel is analysed completely independently, marketers see fragments of what the customer experiences as one research journey.
So instead of ending the monthly report with:
“Instagram generated X impressions and Y engagements.”
Ask another question:
“Where else is our social content being discovered, and what does that tell us about what our audience is looking for?”
That is a more useful application of the data.
The OOm Takeaway
The value of Google Search Console Platform Properties is not that marketers now have more social metrics.
It is that they can see another part of how social content is discovered.
Social analytics show you what happened within the platform.
Search Console tells you whether that content appeared through Google and what people searched before finding it.
Website analytics show you what happened on your owned properties.
Lead and CRM data connects activity with business outcomes.
None should be expected to answer every question.
And none should be stretched beyond what it can prove.
So the next time you see:
11,600 impressions.
48 clicks.
0.4% CTR.
Average position: 11.5.
Do not immediately ask:
“Is this good?”
Ask:
What are we appearing for?
Which content is appearing?
Are those searches relevant?
What other signals are we seeing?
What should we test or create next?
Because the real value of the report is not the number of impressions on the screen.
It is what those impressions teach you about how your content is being discovered.
Turn Search Visibility Into Better Content Decisions
Are your social posts appearing in Google Search? Start by examining what people searched when your content appeared, not simply how many impressions it received.
If you need help connecting those findings with your wider content and measurement strategy, speak to OOm.